Departmental House Prices in France Half Year 2019
Friday 08 November 2019
The notaires have recently published their figures for the movement in house prices for the first half of the year, for each department of France.
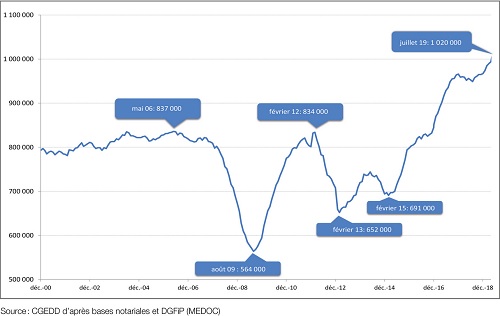
Last month, the notaires published their property market review for the first half year 2019, confirming the provisional information given earlier that sales topped 1 million in the year to July, an increase of 7% over 2018.
The notaires provide no geographic breakdown of sales, but the indications are from their report that the market is a dynamic one in most areas of the country.
However, as Credit Agricole point out in their own review, it is being largely driven by the major conurbations, stating: "Toutefois, ce boom immobilier n’est pas homogène. Il est très marqué dans les grandes villes, notamment Paris, Lyon, Nantes et Bordeaux, plus modéré dans les villes moyennes et zones rurales."
In a similar vein, economic consultants Xerfi state that the housing market in France is like leopard skin: "Une peau de léopard où les taches brunes représentent le plus souvent les grandes agglomérations."
Even within the larger cities there are signs that the market is overheating, with reports that in the third quarter of the year appartment prices in Bordeaux fell. There are similar anecdotal reports about Paris. In some larger towns, prices have fallen, notably in Clermond Ferrand, Metz, Lille, Angers and Perpignan.

Overall on prices, the notaires report that house prices outside of the Ile-de-France rose by an average of 2.4% over a year. In the Ile-de-France apartment prices rose by an average of 4.9%.
Figures previously provided from the major estate agent chains gave increases of ranging from +0.4% to +3.5% over the same period.
As can be seen from the table below, these averages disguise huge disparities across the country, both up and down, although caution is needed in a too literal interpretation of the larger movements due to the limited number of transactions in some departments. That is why we also show the 5-year trend.
In one-third of the departments prices either fell or were stagnant in the year, reflecting the contrasting fortunes of different parts of the country.
Although the majority of the fall in prices occurred in the north and north east, there were also a large number of departments in the south and west where prices fell.
The table shows the percentage movement in prices for each department in the year to June 2019, the percentage price change for the period 2014-19, and the average house price at the end of June 2019, as well as the movement over the past 5 years.
There is however, an urban bias to the analysis, where most sales take place, so they do not necessarily reflect what is happening to rural properties.
The best current analysis available of the rural market was provided in our article Rural House Prices in France 2018.
| House Prices 2019 | |||
| Region/Dept | % Change 2019 | Average % Change 2014-19 | Average Price 2019 |
| AUVERGNE-RHONE-ALPES | |||
| Ain | +0.3% | +12.7% | €195,500 |
| Allier | +5.4% | +7.4% | €96,700 |
| Ardèche | -0.7% | +4.1% | €151,000 |
| Cantal | n/a | +1.5% | €101,500 |
| Drôme | +5.1% | +8.0% | €196,500 |
| Isère | +2.3% | +7.3% | €222,000 |
| Haute-Loire | +10.0% | -3.5% | €110,000 |
| Loire | +1.0% | +1.0% | €155,000 |
| Puy-de-Dôme | -2.0% | +6.7% | €160,000 |
| Rhône | +4.7% | +16.6% | €309,900 |
| Haute-Savoie | +0.7% | +6.9% | €357,600 |
| Savoie | -1.7% | +12.2% | €234,600 |
| BRITTANY | |||
| Côte d'Amour | +6.6% | +8.3% | €130,000 |
| Finistère | +5.0% | +11.0% | €147,000 |
| IIe-et-Vilaine | +1.9% | +4.8% | €183,400 |
| Morbihan | +3.1% | +8.8% | €172,900 |
| BOURGOGNE FRANCHE-COMTE | |||
| Belfort | +2.8% | +7.6% | €155,000 |
| Côte-d'Or | -3.7% | +2.6% | €159,000 |
| Doubs | +3.6% | +7.1% | €172,500 |
| Haute-Saône | +6.2% | +12.3% | €112,300 |
| Jura | -1.9% | +5.7% | €130,000 |
| Nièvre | +3.5% | +6.7% | €80,000 |
| Saône-et-Loire | -2.1% | +2.3% | €120,800 |
| Yonne | +0.9% | +4.5% | €115,000 |
| CENTRE-VAL DE LOIRE | |||
| Cher | 0.0% | +6,4% | €100,000 |
| Eure-et-Loir | +10.4% | +3.0% | €154,500 |
| Indre | +5.4% | -3.7% | €89,600 |
| Indre-et-Loire | +1.7% | +10.4% | €183,000 |
| Loir-et-Cher | -0.5% | -4.1% | €115,100 |
| Loiret | -3.2% | -0.3% | €152,000 |
| GRAND EST | |||
| Ardennes | -15.7% | -13.3% | €91,000 |
| Aube | -0.9% | -2.2% | €122,000 |
| Haute-Marne | -6.3% | -17.0% | €75,000 |
| Marne | -4.2% | -0.6% | €158,100 |
| Meurthe-et-Moselle | +3.0% | +2.3% | €149,300 |
| Meuse | -9.9% | -19.2% | €82,000 |
| Moselle | +0.5% | +11.7% | €167,500 |
| Bas-Rhin | +3.8% | +11.6% | €223,200 |
| Haut-Rhin | +5.0% | +13.5% | €210,000 |
| Vosges | -5.2% | -7.0% | €102,000 |
| HAUTS DE FRANCE | |||
| Aisne | -3.6% | +4.4% | €106,000 |
| Nord | +2.0% | +4.2% | €150,000 |
| Oise | 0.0% | +2.3% | €180,000 |
| Pas-de-Calais | -0.5% | +4.9% | €134,300 |
| Somme | 0.0% | +4.2% | €125,000 |
| ILE-DE-FRANCE* | |||
| Paris | +2.1% | +21.6% | €9,890m2 |
| Seine-Saint-Denis | +5.4% | +10.5% | €3,530m2 |
| Haute-de-Seine | +4.6% | +11.6% | €5,880m2 |
| Val-et-Marne | +3.9% | +8.2% | €4,530m2 |
| Val d'Oise | +0.9% | -1.0% | €2,680m2 |
| Yvelines | +2.1% | +2.0% | €3,820m2 |
| Essonne | +1.3% | -1.1% | €2,620m2 |
| Seine-et-Marne | +1.4% | -0.4% | €2,620m2 |
| NOUVELLE-AQUITAINE | |||
| Charente | +7.4% | +12.7% | €115,000 |
| Charente-Maritime | +0.3% | +9.3% | €180,500 |
| Corrèze | +14.9% | +0.9% | €116,000 |
| Creuse | +22.6% | 0.0% | €65,000 |
| Deux-Sèvres | -4.5% | +5.0% | €105,000 |
| Dordogne | +1.4% | 0.0% | €117,000 |
| Gironde | +3.2% | +21.5% | €252,700 |
| Landes | +9.0% | +23.1% | €200,000 |
| Lot-et-Garonne | +3.1% | +4.0% | €123,800 |
| Pyrénées-Atlantiques | +2.8% | +0.2% | €215,500 |
| Haute-Vienne | -2.7% | -6.7% | €110,000 |
| Vienne | +4.5% | +7.1% | €128,600 |
| OCCITANIE | |||
| Ariège | +1.5% | +10.0% | €104,500 |
| Aude | -0.6% | -1.5% | €131,000 |
| Aveyron | -12.5% | +1.3% | €96,300 |
| Gard | -1.3% | +2.7% | €190,000 |
| Gers | +12.2% | +6.7% | €140,000 |
| Haute-Garonne | -0.5% | +1.7% | €232,800 |
| Hautes-Pyrénées | -4.0% | -9.4% | €130,700 |
| Hérault | +3.6% | +7.3% | €217,500 |
| Lot | +7.8% | +2.5% | €124,000 |
| Lozère | +12.5% | -14.3% | €90,000 |
| Pyrénées-Orientales | -1.2% | +9.8% | €170,000 |
| Tarn | +4.6% | -0.9% | €130,800 |
| Tarn-et-Garonne | 0.0% | +7.7% | €140,000 |
| NORMANDY | |||
| Calvados | +4.8% | +11.4% | €178,200 |
| Manche | +4.0% | +6.6% | €130,000 |
| Orne | -5.9% | +2.2% | €95,000 |
| Eure | +0.2% | +2.2% | €150,300 |
| Seine-Maritime | +2.5% | +2.5% | €153,800 |
| PAYS DE LA LOIRE | |||
| Loire-Atlantique | +1.8% | +14.7% | €218,000 |
| Maine-et-Loire | +4.6% | +8.8% | €146,500 |
| Mayenne | +2.0% | -4.7% | €102,000 |
| Sarthe | -1.6% | +1.9% | €123,000 |
| Vendée | +4.1% | +9.7% | €158,000 |
| PROVENCE-ALPES-COTE D'AZUR | |||
| Alpes-de-Haute-Provence | +6.3% | +0.7% | €170,000 |
| Alpes-Maritimes | +2.4% | -2.3% | €430,000 |
| Bouches-du-Rhône | +4.4% | +12.3% | €314,400 |
| Hautes-Alpes | -2.9% | +23.4% | €212,200 |
| Var | -0.5% | +4.4% | €313,200 |
| Vaucluse | +7.1% | +6.7% | €225,000 |
Source: Notaires de France
Thank you for showing an interest in our News section.
Our News section is no longer being published although our catalogue of articles remains in place.
If you found our News useful, please have a look at France Insider, our subscription based News service with in-depth analysis, or our authoritative Guides to France.
If you require advice and assistance with the purchase of French property and moving to France, then take a look at the France Insider Property Clinic.


