House Prices in France Third Quarter 2016
Monday 06 February 2017
The notaires report that house prices outside of Paris rose by an average of 1.5% in the third quarter, reflecting the high level of sales activity in the market.
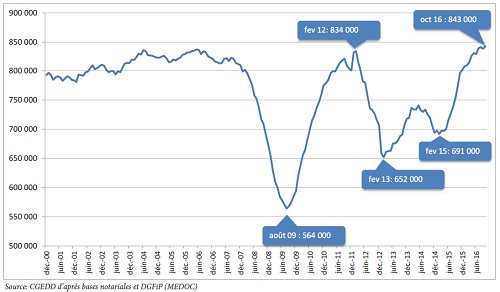
The latest review of the housing market in France by the notaires underlines the strong level of sales that has occurred, with 9% growth in the year to October 2016 on the same period for 2015, to reach 843,000 total sales.

The notaires attribute the continuing buoyancy to:
- Low interest rates;
- The fall in prices;
- The success of tax efficient investment schemes;
- The availability of interest free loans for first-time buyers.
The 'safe-haven' status of real estate has also been a factor, with the notaires stating: "Face aux placements financiers aux rendements incertains, les ménages se tournent vers des valeurs refuges, dont l’immobilier constitue l’une des préférées des Français."
To supplement the national analysis, the notaires have separately published third quarter house price changes for each department of France.
The table below shows the average percentage price change in each department for each of the first three quarters of 2016, as well as the movement in prices for the year ending 31st December 2015,
As can be seen, some very large increases in prices in the third quarter are being reported, but caution is needed in reading too much into the figures for a single quarter as there are unlikely to have been enough transactions in the period to be able to come to a clear judgement about the state of the market.
The lack of comparable transactions may well be the principal reason why there are simply no Qtr 3 figures available for quite a large number of departments. In these cases, it may well be the case that prices are continuing to fall or remain stable.
The best that can be said is that the price momentum does appear to be quickening and becoming more widespread, but that there are substantial divergences in the market, notably between urban and rural areas, with the level of activity in the former that has yet to occur in the countryside.
As the notaires themselves state: "L’inversion de tendance de la courbe des prix dès la fin 2015 à Paris, et tout au long de l’année 2016 dans les villes de province dynamiques, ne s’est pas encore réalisée en secteur rural."
Accordingly, as the analysis provided by the notaires is drawn from transactions in the main urban areas of each department they do not reflect the movement in rural house prices.
| House Prices 2016 | ||||
| Region/Dept | % Change 2015 | % Change Q1 | % Change Q2 | % Change Q3 |
| AUVERGNE-RHONE-ALPES | ||||
| Ain | +0.2% | +3.5% | +0.5% | +5.9% |
| Allier | -2.9% | -6.7% | +3.4% | +7.1% |
| Ardèche | +0.3% | -9.5% | +6.3% | +7.7% |
| Cantal | -0.5% | n/a | +7.0% | n/a |
| Drôme | +0.2% | -3.0% | -0.8% | +5.0% |
| Isère | +1.5% | +1.4% | 0.0% | +8.3% |
| Haute-Loire | -0.5% | +1.5% | -1.8% | n/a |
| Loire | +0.6% | 0.0% | +3.3% | +3.2% |
| Puy-de-Dôme | +1.9% | +1.5% | +5.0% | +6.2% |
| Rhône | +1.1% | -2.8% | +8.9% | +2.0% |
| Haute-Savoie | +0.3% | -1.4% | -0.1% | +5.2% |
| Savoie | +0.6% | +0.9% | +9.6% | +2.7% |
| BRITTANY | ||||
| Côte d'Amour | +1.9% | -3.0% | +3.1% | +2.7% |
| Finistère | +1.7 | -3.6% | +3.0% | +1.4% |
| IIe-et-Vilaine | +2.4% | -1.2% | 0.0% | +2.7% |
| Morbihan | -0.8% | -1.8% | -1.8% | +9.5% |
| BOURGOGNE FRANCHE-COMTE | ||||
| Belfort | -2.1% | -7.3% | -3.7% | n/a |
| Côte-d'Or | +0.1% | +4.1% | -5.5% | n/a |
| Doubs | -1.4% | -5.9% | +2.9% | +2.5% |
| Haute-Saône | -3.3% | -9.1% | n/a | -4.9% |
| Jura | -2.4% | +8.3% | +3.8% | 0.0% |
| Nièvre | -0.4% | -6.7% | 0.0% | +2.9% |
| Saône-et-Loire | +0.8% | -2.9% | -0.6% | +5.3% |
| Yonne | -2.1% | 0.0% | -3.5% | +4.5% |
| CENTRE-VAL DE LOIRE | ||||
| Cher | -2.0% | -1.0% | -0.2% | n/a |
| Eure-et-Loir | -2.8% | -4.9% | +5.8% | +0.7% |
| Indre | +6.7% | n/a | +4.7 | +2.3% |
| Indre-et-Loire | +0.7% | -1.0% | +5.7% | +3.9% |
| Loir-et-Cher | -0.8% | +4.5% | -2.4% | +6.2% |
| Loiret | -1.2% | 0.0% | +2.2% | +6.2% |
| GRAND EST | ||||
| Ardennes | +1.4% | -4.2% | +2.3% | -5.7% |
| Aube | -5.0% | +5.7% | -3.8% | +8.0% |
| Haute-Marne | -2.9% | n/a | n/a | n/a |
| Marne | -2.9% | +9.7% | -8.2% | n/a |
| Meurthe-et-Moselle | -1.0% | -8.0% | +6.1% | +5.3% |
| Meuse | -3.3% | +2.0% | n/a | n/a |
| Moselle | +0.8% | -1.7% | +1.8% | +5.8% |
| Bas-Rhin | +2.2% | +2.8% | +2.0% | +3.0% |
| Haut-Rhin | +1.8% | +6.8% | -5.4% | -2.6% |
| Vosges | -3.4% | -9.1% | n/a | +3.5% |
| HAUTS DE FRANCE | ||||
| Aisne | -1.4% | -6.4% | -2.9% | n/a |
| Nord | +1.0% | -3.4% | +1.3% | +5.0% |
| Oise | +1.6% | -6.4% | -1.7% | +4.7% |
| Pas-de-Calais | +1.6% | -3.7% | 0.0% | +7.3% |
| Somme | -3.9% | -7.6% | +5.3% | +0.8% |
| ILE-DE-FRANCE* | ||||
| Paris | -0.4% | +0,2% | +1.2% | +2.1% |
| Seine-Saint-Denis | -1.6% | -0.5% | +0.8% | +2.7% |
| Haute-de-Seine | -2.5% | +0.3% | +1.3% | +2.5% |
| Val-et-Marne | -1.3% | -0.2% | +1.2% | +2.6% |
| Val d'Oise | -1.4% | -0.4% | +0.3% | +2.9% |
| Yvelines | -3.8% | 0.0% | +0.8% | +2.8% |
| Essonne | -1.1% | -1.0% | +0.1% | +3.2% |
| Seine-et-Marne | -1.4% | -1.5% | +0.1% | +3.1% |
| NOUVELLE-AQUITAINE | ||||
| Charente | -0.3% | -4.3% | +9.0% | +1.0% |
| Charente-Maritime | -0.0% | -4.0% | +0.3% | +1.1% |
| Corrèze | -1.9% | +5.1% | -9.5% | n/a |
| Creuse | -0.8% | n/a | +4.3% | n/a |
| Deux-Sèvres | -1.1% | 0.0% | +6.4% | +3.2% |
| Dordogne | +1.2% | n/a | -8.0% | +3.4% |
| Gironde | +2.9% | -2.3% | +8.1% | +3.5% |
| Landes | -2.5% | +4.3% | -3.8% | +0.9% |
| Lot-et-Garonne | +1.6% | -0.8% | -8.0% | n/a |
| Pyrénées-Atlantiques | -1.7% | +4.9% | -1.4% | -0.5% |
| Haute-Vienne | -1.9% | -3.8% | +4.3% | +4.2% |
| Vienne | -2.7% | -4.6% | +2.8% | n/a |
| OCCITANIE | ||||
| Ariège | +4.1% | +7.5% | n/a | n/a |
| Aude | +1.4% | +5.5% | n/a | n/a |
| Aveyron | +1.6% | n/a | +5.1% | -4.3% |
| Gard | -0.4% | -1.0% | +2.1% | +4.2% |
| Gers | +1.5% | -2.1% | n/a | n/a |
| Haute-Garonne | +0.8% | +1.8% | -3.7% | +6.7% |
| Hautes-Pyrénées | +3.1% | -8.8% | +0.8 | n/a |
| Hérault | +1.3% | -3.1% | +2.4% | +4.2% |
| Lot | +1.5% | -7.5% | n/a | +3.5% |
| Lozère | -0.7% | n/a | -10.0% | -4.3% |
| Pyrénées-Orientales | +0.9% | -4.9% | +6.3% | +3.8% |
| Tarn | +1.9% | n/a | +2.7% | -2.3% |
| Tarn-et-Garonne | +1.3% | 0.0% | -6.0% | +5.5% |
| NORMANDY | ||||
| Calvados | +0.6% | +3.2% | -1.0% | +2.8% |
| Manche | +0.2% | -0.2% | -1.4% | +7.5% |
| Orne | -1.4% | -8.2% | +8.1% | -1.3% |
| Eure | +0.3% | -1.4% | +2.8% | +7.1% |
| Seine-Maritime | +0.4% | 0.0% | -0.7% | +5.3% |
| PAYS DE LA LOIRE | ||||
| Loire-Atlantique | +2.3% | +1.0% | +1.0% | +7.0% |
| Maine-et-Loire | +2.6% | -10% | 0.0% | +8.8% |
| Mayenne | +2.9% | +4.8% | 0.0% | n/a |
| Sarthe | +1.3% | -2.1% | -1.7% | +6.9% |
| Vendée | -0.1% | +0.1% | 0.0% | +4.2% |
| PROVENCE-ALPES-COTE D'AZUR | ||||
| Alpes-de-Haute-Provence | +0.3% | n/a | +9.4% | n/a |
| Alpes-Maritimes | +1.7% | +0.5% | +0.1% | +2.3% |
| Bouches-du-Rhône | -1.4% | 0.0% | +0.2% | +3.4% |
| Hautes-Alpes | +0.3% | n/a | +3.9% | -3.0% |
| Var | +1.1% | +1.6% | +0.5% | +0.3% |
| Vaucluse | -0.2% | -3.9% | -0.7% | +1.8% |
Source: Notaires de France
Next Article: Mixed Residency Status in France
Thank you for showing an interest in our News section.
Our News section is no longer being published although our catalogue of articles remains in place.
If you found our News useful, please have a look at France Insider, our subscription based News service with in-depth analysis, or our authoritative Guides to France.
If you require advice and assistance with the purchase of French property and moving to France, then take a look at the France Insider Property Clinic.


