Covid 19 France - Alert Levels on the Increase
Tuesday 06 October 2020
The virus is now circulating widely in most departments, with several areas in a state of maximum alert.
Last week, the French government published the results of Covid-19 testing activity for the week ending 29th September, the latest period for which there is a full 7-day rolling average.
During the week 885,000 individuals were tested in mainland France, of whom 67,875 tested positive. This compares with 688,000 tested at the end of August, of whom 25,410 tested positive.
The rate of infection was 104 cases/100,000 inhabitants, against 39/100,000 at the end of August. The infection rate has since increased to 107/100,000.
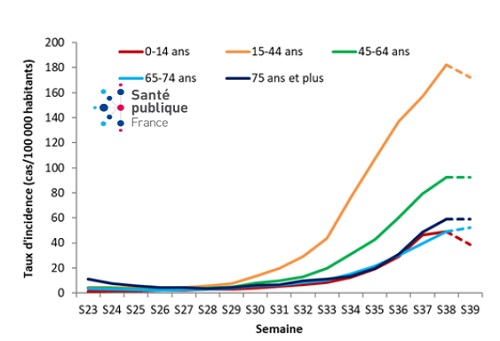
There are of course major geographic variations, but also big differences by age group; the rate is 172/100,000 in the 15-44 age range, but 52/100,000 in the 65-74 range, the latter no doubt because of self-isolating. The following graphic shows the trend since June by age range.

The percentage number testing positive was 7.9%, compared to 3.7% at the end of last month. More recent data shows the number testing positive at 8.6%.
In terms of test and trace, 92% of the positive cases and 96% of the persons identified as at-risk contacts were reached by the local health authorities who run the test and trace system.
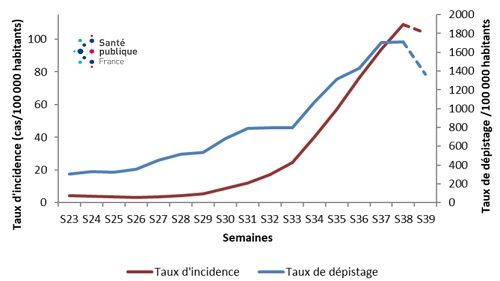
The following graphic shows the rate of infection (taux incidence) and the rate of testing (taux de dépistage) for the end of the month, which shows the infection rate is increasing faster than the rate of testing, although as we stated last month, higher screening activity will mean that this is likely to happen.

As infection rates increase, so has the number of hospitalisations and deaths. There are now (5th Oct) 7,296 patients in hospital with Covid-19, up from 4,594 at the end of August. Over 1,400 are in intensive care. There has been a total of 21,494 hospital deaths since 1st March, 70 in the past 24 hours. Total deaths, including elderly homes, is 32,299. Most hospitalisations and deaths are around Paris and Marseilles.
The graphic below shows the daily trend in hospitalisations since March 2020.

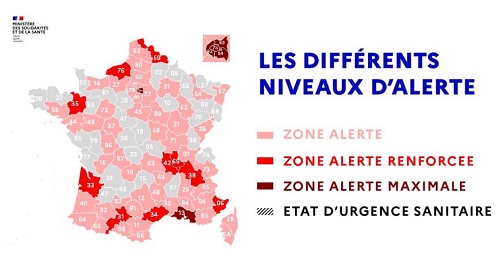
As the virus is now circulating widely in most areas of France, the government last month introduced a new classification system for the determining the intensity of the pandemic in each department and the measures that should be taken.
The alert level is now determined by three factors over a rolling 7-day average:
- General Infection Rate - the number of new cases per 100,000 inhabitants;
- Elderly Infection Rate - the number of new cases per 100,000 inhabitants aged 65+;
- Intensive Care - the number of Covid patients occupying hospital intensive care beds.
There are four alert levels, as follows:
- Zone Alerte - 50 cases per 100,000 inhabitants;
- Zone Alerte Renforcée - 150 cases per 100,000 inhabitants + 50/100,000 65+ inhabitants;
- Zone Alerte Maximale - 250 cases per 100,000 inhabitants + 100/100,000 65+ inhabitants + 30% Covid patients;
- Etat Urgence Sanitaire - >250 cases per 100,000 inhabitants +100/100,000 65+ inhabitants + 60% Covid patients.
In those departments coloured light grey there is no level of alert.

The classification is, however, a confusing one, for in those departments where there is either a reinforced or maximum level of alert in place the alert level may only apply in part of the department.
Thus, although the whole of the Bouches-du-Rhône is shown on maximum alert, in fact that alert level only applies to the metropolitan area of Aix-Marseille. The same applies in several other departments, where although some metropolitan areas are in a stated of reinforced alert (Bordeaux, Lyon, Nice, Lille, Toulouse, Saint-Etienne, Rennes, Rouen, Grenoble, Montpellier) the remainder of the department is at a lower level.
Paris and the surrounding departments of Val-de-Marne, Saint-Denis and Hauts-de-Seine are also on maximum alert. In these departments, as well as in Aix-Marseille, substantial restrictions on circulation apply, such as closure of bars. Restaurants are being allowed to remain open, although subject to strict rules of hygiene.
Testing
The following table provides a summary of testing activity in each department, with the main results of that testing in the final week of September. The figures do of course vary on a daily basis, but the latest weekly figures are a better indicator of the position in each department.
In the week, all departments exceeded the threshold of 10 confirmed cases/100,000 inhabitants, 41 departments were above 50/100,000 inhabitants and 21 above 100/100,000 inhabitants.
The highest rates were in Paris (272/100,000 inhabitants), in the Rhône (220), Nord (205) and Haute-Garonne (205) departments.
Double digit positive rates occurred in Paris and surrounding departments, as well as Isère (12.9%), Rhône (11.5%), Haut-Garonne (10.5%), and Loire (10%).
The metropolitan departments with the highest screening rates were Nord (2,181/100,000 inhabitants), Bouches-du Rhône (2,151), Paris (2,128) and Haute-Garonne (1,945).
As we stated last week, these departmental figures cannot show how localised are the outbreaks, which may be occurring in a small number of communes within each department. However, more localised statistics are not widely available.
| Covid-19 - Testing | ||||
| Region/Dept | Number of Persons Tested | Percentage Testing Positive | Infection Rate Per 100,000 | |
| AUVERGNE-RHONE-ALPES | ||||
| Ain | 7,739 | 6.8% | 80.1 | |
| Allier | 3,410 | 2.8% | 29.3 | |
| Ardèche | 2,948 | 3.6% | 32.7 | |
| Cantal | 1,579 | 3.5% | 38.5 | |
| Drôme | 5,346 | 5.6% | 57.8 | |
| Isère | 15,634 | 12.9% | 159.9 | |
| Haute-Loire | 2,874 | 4.9% | 62.1 | |
| Loire | 12,415 | 10.0% | 162.5 | |
| Puy-de-Dôme | 9,446 | 5.5% | 78.9 | |
| Rhône | 35,991 | 11.5% | 220.2 | |
| Haute-Savoie | 7,379 | 5.1% | 45.9 | |
| Savoie | 4,858 | 5.8% | 65.0 | |
| BRITTANY | ||||
| Côte d'Amour | 5,980 | 3.4% | 33.7 | |
| Finistère | 10.527 | 2.8% | 32.7 | |
| IIe-et-Vilaine | 15,462 | 8.2% | 116.5 | |
| Morbihan | 7,715 | 3.6% | 36.3 | |
| BOURGOGNE FRANCHE-COMTE | ||||
| Belfort | 1,622 | 2.5% | 29.3 | |
| Côte-d'Or | 7,717 | 7.6% | 110.3 | |
| Doubs | 7,319 | 4.3% | 58.2 | |
| Haute-Saône | 2,354 | 2.2% | 21.9 | |
| Jura | 2,904 | 4.3% | 48.9 | |
| Nièvre | 2,388 | 3.2% | 38.1 | |
| Saône-et-Loire | 7,529 | 5.1% | 69.5 | |
| Yonne | 3,533 | 7.0% | 75.0 | |
| CENTRE-VAL DE LOIRE | ||||
| Cher | 2,777 | 3.1% | 28.7 | |
| Eure-et-Loir | 3,693 | 6.0% | 51.7 | |
| Indre | 1,720 | 3.6% | 28.6 | |
| Indre-et-Loire | 8,869 | 5.1% | 74.0 | |
| Loir-et-Cher | 3,195 | 4.5% | 43.9 | |
| Loiret | 9,121 | 6.1% | 81.3 | |
| GRAND EST | ||||
| Ardennes | 3,365 | 2.7% | 33.9 | |
| Aube | 2,690 | 4.5% | 38.7 | |
| Haute-Marne | 1,305 | 3.1% | 23.6 | |
| Marne | 7,447 | 5.3% | 69.5 | |
| Meurthe-et-Moselle | 10,125 | 3.1% | 42.3 | |
| Meuse | 2,133 | 2.1% | 24.8 | |
| Moselle | 13,099 | 2.4% | 29.7 | |
| Bas-Rhin | 19,219 | 3.1% | 52.5 | |
| Haut-Rhin | 8,872 | 2.5% | 28.8 | |
| Vosges | 3,368 | 2.0% | 19.2 | |
| HAUTS DE FRANCE | ||||
| Aisne | 4,873 | 5.2% | 48.5 | |
| Nord | 56,600 | 9.4% | 204.6 | |
| Oise | 9,890 | 8.4% | 100.2 | |
| Pas-de-Calais | 23,348 | 6.6% | 106.1 | |
| Somme | 8,729 | 6.0% | 91.6 | |
| ILE-DE-FRANCE | ||||
| Paris | 47,875 | 12.3% | 272.9 | |
| Seine-Saint-Denis | 23,389 | 12.9% | 181.1 | |
| Hauts-de-Seine | 29,960 | 10.5% | 194.8 | |
| Val-de-Marne | 21,094 | 11.1% | 166.6 | |
| Val d'Oise | 16,496 | 10.8% | 142.3 | |
| Yvelines | 17,119 | 10.2% | 120.5 | |
| Essonne | 15,417 | 11.6% | 135.8 | |
| Seine-et-Marne | 15,207 | 9.6% | 102.4 | |
| NOUVELLE-AQUITAINE | ||||
| Charente | 3,032 | 5.0% | 43.7 | |
| Charente-Maritime | 5,933 | 2.6% | 24.1 | |
| Corrèze | 2,622 | 5.0% | 54.5 | |
| Creuse | 966 | 2.0% | 16.3 | |
| Deux-Sèvres | 3,526 | 2.8% | 26.3 | |
| Dordogne | 4,206 | 3.6% | 37.5 | |
| Gironde | 21,911 | 7.6% | 101.9 | |
| Landes | 5,447 | 6.0% | 79.4 | |
| Lot-et-Garonne | 2,579 | 8.3% | 64.5 | |
| Pyrénées-Atlantiques | 10,117 | 5.9% | 87.8 | |
| Haute-Vienne | 4,600 | 6.6% | 81.7 | |
| Vienne | 4,716 | 6.8% | 73.8 | |
| OCCITANIE | ||||
| Ariège | 2,458 | 6.5% | 104.3 | |
| Aude | 4,603 | 5.3% | 65.5 | |
| Aveyron | 4,081 | 5.5% | 80.8 | |
| Gard | 9,788 | 8.3% | 108.2 | |
| Gers | 2,244 | 7.6% | 89.5 | |
| Haute-Garonne | 27,472 | 10.5% | 205.2 | |
| Hautes-Pyrénées | 3,382 | 5.6% | 82.9 | |
| Hérault | 16,664 | 6.9% | 97.4 | |
| Lot | 2,202 | 4.3% | 54.3 | |
| Lozère | 807 | 6.6% | 69.5 | |
| Pyrénées-Orientales | 7,228 | 5.6% | 85.2 | |
| Tarn | 5,164 | 7.6% | 101.8 | |
| Tarn-et-Garonne | 3,637 | 7.2% | 99.4 | |
| NORMANDY | ||||
| Calvados | 8,025 | 5.4% | 62.9 | |
| Manche | 4,407 | 3.4% | 30.4 | |
| Orne | 2,647 | 4.3% | 41.2 | |
| Eure | 5,622 | 9.1% | 84.9 | |
| Seine-Maritime | 16,480 | 9.4% | 125.1 | |
| PAYS DE LA LOIRE | ||||
| Loire-Atlantique | 16,285 | 5.8% | 66.2 | |
| Maine-et-Loire | 11,531 | 5.0% | 70.0 | |
| Mayenne | 3,720 | 4.8% | 58.0 | |
| Sarthe | 6,930 | 5.4% | 67.1 | |
| Vendée | 6,697 | 4.4% | 43.5 | |
| PROVENCE-ALPES-COTE D'AZUR | ||||
| Alpes-de-Haute-Provence | 2,589 | 4.9% | 76.3 | |
| Alpes-Maritimes | 14,644 | 6.6% | 89.1 | |
| Bouches-du-Rhône | 44,134 | 8.9% | 193.2 | |
| Hautes-Alpes | 1,255 | 5.9% | 52.2 | |
| Var | 13,873 | 4.6% | 58.9 | |
| Vaucluse | 6,840 | 6.3% | 77.4 | |
Thank you for showing an interest in our News section.
Our News section is no longer being published although our catalogue of articles remains in place.
If you found our News useful, please have a look at France Insider, our subscription based News service with in-depth analysis, or our authoritative Guides to France.
If you require advice and assistance with the purchase of French property and moving to France, then take a look at the France Insider Property Clinic.


